1. Matlab基础
1.1. 变量
变量定义规则如下:
与C语言类似;
注意:
变量在使用前不需要预先声明,也不需要指定类型,
MATLAB会自动识别处理;文件名是纯数字,
matlab不会语法报错,该文件执行结果为文件名,如:变量名大小写敏感,可以是字母、数字、下划线,不可以是标点符号xinit %okay VRightInitial %okay 4You2do %not okay Start-up %not okay vector%1 %not okay TargetOne %okay ThisIsAVeryVeryLongVariableName %okay ThisIsAVeryVeryLongVariablename %okay, but different from previous x_temp %okay工作区的变量
clear a v g %clears the variables a v g from the workspace clear %clears all variables from the workspace who %lists the currently defined variables whos %displays a detailed list of defined variables save %saves the current workspace to the file called matlab.mat save foobar %saves the current workspace to the file called foobar.mat load %loads variables saved in matlab.mat into the current workspace load foobar %loads variables saved in foobar.mat into the current workspacefiles=dir()- 得到当前目录下的文件(夹)结构体数组
如果要列出当前文件夹内后缀是
jpg的文件,该如何操作?文件1.m中有语句:
C=[2 3] 则打开
1.m文件,按F5,执行结果是2 3;>> a=4; % class double >> fname='Robert'; % class char >> temperature=101.2; % class double >> isDone=true; % class logical赋值回显
>> a=4.2
a =
4.2000
>> a=5.5;
>>
表达式
右赋值模式,包括数字组合、算术运算、函数等
>> a=4*7+2.2;
>> b=sin(3.28);
>> r=a+b;
>> x2=x1+4*sin(theta);
>> zInit=1+yInit/cos(a*xInit);
>> k=k+1;
赋值的一般形式:
>> r=a=4; % not a valid MATLAB statement >> a+1=press-2; % not a valid MATLAB statement >> 4=a; % not a valid MATLAB statement >> 'only the lonely'='how I feel'; % not a valid MATLAB statement>> nr=nr+1; % increment nr
数字与函数
>> 6.0221415e23  %6.0221415 × 10²³
>> -1.602e-19    %−1.602 × 10⁻¹⁹
>> 5.2+2.1i      % 复数
+ %addition - %subtraction * %multiplication / %division ˆ %exponentiation, e.g., 1.3ˆ3.2 is 1.33.2 sin(x) %returns the sine of x sind(x) %returns the sine of x degrees cos(x) %returns the cosine of x cosd(x) %returns the cosine of x degrees tan(x) %returns the tangent of x tand(x) %returns the tangent of x degrees atan(x) %returns the inverse tangent of x atand(x) %returns the inverse tangent of x in degrees acos(x) %returns the inverse cosine of x acosd(x) %returns the inverse cosine of x in degrees asin(x) %returns the inverse sine of x asind(x) %returns the inverse sind of x in degrees exp(x) %returns ex log(x) %returns the natural logarithm of x log10(x) %returns the log10(x) sqrt(x) %returns the square root of x abs(x) %returns the absolute value of x round(x) %returns the integer closest to x ceil(x) %returns the smallest integer greater than or equal to x floor(x) %returns the largest integer less than or equal to x isprime(n) %returns true if n is prime factor(k) %returns prime factors of k sign(x) %returns the sign (1 or −1) of x; sign(0) is 0 rand %returns a pseudorandom number between 0 and 1 rand(m) %returns an m × m array of random numbers rand(m,n) %returns an m × n array of random numbers系统帮助文档
help <subject> %returns brief documentation on MATLAB feature <subject>
doc <subject> %returns full documentation on MATLAB feature <subject> can also be accessed by searching MATLAB Help for <subject>
1.2. 数据类型
Matlab默认数据类型为double型- 不同类型之间通过数据类型转换实现,如:
a=123; b=uint8(a); c=char(a);%得到的是ascii码为123的字符- 图像读入的数据类型为
uint8型:[0,255]Matlab中常用字符类型识别文件,实现数据文件的操作,如:
A=load('data.txt');
1.3. 逻辑类型
逻辑类型可用于提升matlab中for循环的效率,如
c=1:50000;
t1=clock;d1=c>5000;d2=c(d1);t2=clock;
t=etime(t2,t1)
k=1;
for i=1:length(c)
    if c(i)>5000
        d(k)=c(i);
        k=k+1;
    end
end
t3=clock;t=etime(t3,t2)
1.4. 字符类型
通过单引号表示字符类型
firstname='Alfonso'; lastname='Bedoya'; idea1='Buy low, sell high';>> disp(firstname) Alfonso >> disp(lastname) Bedoya字符合并
% <newstring>=[<str1>,<str2>,<str3>,...];>> fname=[firstname,lastname]; >> disp(fname) AlfonsoBedoya >> fullname=[firstname,' ',lastname]; >> disp(fullname) Alfonso Bedoya >> disp([idea1, ', young ', firstname, '!' ] ); Buy low, sell high, young Alfonso!一些有用的和字符类型有关的函数
num2str(x) %returns a string corresponding to the number stored in x str2num(s) %returns a number corresponding to the string s str2double(s) %returns a number corresponding to the string s (also works with cell arrays of strings, defined later) length(s) %returns the number of characters in the string sName lower(s) %returns the string s in all lowercase upper(s) %returns the string s in all uppercase sName(4) %returns the 4th character in the string sName sName(4:6) %returns the 4th through the 6th characters in the string sNameDisp命令打印变量值>> vinit=412.43; >> disp(vinit) % minimal 412.4300 >> disp(['Initial velocity = ',num2str(vinit),' cm/s']) Initial velocity = 412.43 cm/s用户交互
nYears=input('Enter the number of years: ');
firstName=input('Please enter your first name: ','s')
1.5. 向量
>> vp=[1, 4, 5, 9];
>> disp(vp)
1 4 5 9
>> disp(vp(2))
4
>> disp(vp(4))
9
>> vp(1)=47;
>> vp(3)=1.2;
>> disp(vp)
47.0000 4.0000 1.2000 9.0000
转置
>> disp(vp)
47.0000 4.0000 1.2000 9.0000
>> disp(vp')
47.0000
4.0000
1.2000
9.0000
向量运算
% Multiplication by a scalar
>> disp(vp)
47.0000 4.0000 1.2000 9.0000
>> a=0.5*vp
a =
23.5000 2.0000 0.6000 4.5000
% Addition with a scalar >> disp(vp) 47.0000 4.0000 1.2000 9.0000 >> a=vp+2 a = 49.0000 6.0000 3.2000 11.0000 >> a=vp-5 a = 42.0000 -1.0000 -3.8000 4.0000% Element-by-element operation with two vectors >> a=[1, 4, 18]; >> b=[9, 1, 2]; >> a+b ans = 10 5 20 >> a-b ans = -8 3 16% Element-by-element multiplication or division must be indicated with the compound symbols .* and ./, respectively. >> a=[1, 4, 18]; >> b=[9, 1, 2]; >> a./b ans = 0.1111 4.0000 9.0000>> a.*b ans = 9 4 36>> a=[1, 2, 4, 5]; b=a.ˆ2; >> disp(b) 1 4 16 25% Many MATLAB functions operate on vectors element by element. For example: >> thetaDeg=[0, 30, 45, 60, 90]; >> r=1; >> x=r*cosd(thetaDeg); >> y=r*sind(thetaDeg); >> disp(x) 1.0000 0.8660 0.7071 0.5000 0 >> disp(y) 0 0.5000 0.7071 0.8660 1.0000 >> disp(x.*x+y.*y) 1 1 1 1 1 % illustrating trig identity sinˆ2(t)+cosˆ2(t)=1% The length function returns the number of elements in the vector >> v=[3, 5, 7, 9, 13, 55]; >> nv=length(v) nv = 6% The colon operator can be used to index a subset of the vector >> v=[3, 5, 7, 9, 13, 55]; >> a=v(2:5) a = 5 7 9 13% Individual elements can also be picked out to form a new vector >> b=v([1, 3, 6]) b = 3 7 55 % Note that the square brackets are important here% The symbol end is interpreted as meaning the index of the last element in the vector. >> a=[1, 3, 4, 5]; >> disp(a(2:end)) 3 4 5% Concatenating vector >> a=[1, 2, 3];b=[4, 5, 6]; >> c=[a,b]; >> disp(c) 1 2 3 4 5 6 >> c2=[b, a]; c3=[20, a, 21]; >> disp(c2) 4 5 6 1 2 3 >> disp(c3) 20 1 2 3 21特殊的向量函数
>> g0=ones(1,5);disp(g0) 1 1 1 1 1 >> p0=zeros(1,5);disp(p0) 0 0 0 0 0 >> rv=rand(1,5);disp(rv) 0.6154 0.7919 0.9218 0.7382 0.1763% linspace, which generates a vector with a set of equally spaced points >> t=linspace(0, 90, 7); >> disp(t) 0 15 30 45 60 75 90% The colon operator (:) also creates an equally spaced vector of numbers. >> 1:2:10 ans = 1 3 5 7 9 >> 0:0.2:1.3 ans = 0 0.2000 0.4000 0.6000 0.8000 1.0000 1.2000 >> 5:-0.5:3 ans = 5.0000 4.5000 4.0000 3.5000 3.0000统计函数
max(v) %value of the smallest element of array v min(v) %value of the largest element of array v sum(v) %sum of the elements of array v mean(v) %average value of the elements of array v median(v) %median of the elements of array v mode(v) %mode of the elements of array v std(v) %standard deviation the elements of array v sort(v) %returns vector sorted in ascending order>> x=[2, 1, 2, 5, 6, 10, 11, 10]; >> median(x) ans = 5.5000 >> mean(x) ans = 5.8750 >> mode(x) ans = 2 >> std(x) ans = 4.0510
1.6. 结构体类型
Matlab中结构体成员的引用:>> student.name = '张三三'; >> student.age = 20; >> student.grade = 4; >> student.subject = {'Chinese','math','english'}; >> student>> student = struct('name','张三三','age','20','grade','4','subject','Chinese,Math,English')
1.7. 元胞数组
cell构造:(
左标志法,右标志法)例:构造
2x2单元数组% 左标志法: stu{1,1}='zhao' stu{1,2}='computer' stu{2,1}=95 stu{2,2}=true % 右标志法: stu(1,1)={'zhao'} stu(1,2)={'computer'} stu(2,1)={95} stu(2,2)={true} % 单元数组访问: s1=stu{1,2}
1.8. 矩阵和数组
直接输入矩阵
矩阵每行元素都必须用空格或逗号分开
矩阵每行以分号或回车表示结束
整个矩阵必须包含在方括号中
例:
>>A=[1,2,3;4,5,6;7,8,9]
>>A=[1:3;1:2:5;0.3:0.1:0.5]
格式n:s:m表示产生从n到m步长为s一系列值,当s为默认时,步长为1。步长也可以为正数、负数和小数。
由函数创建矩阵
ones(n),ones(m,n)
zeros(n),zeros(m,n)
eye(n),eye(m,n)
rand(n),rand(m,n)
randn(n),randn(m,n)
magic(n) %魔方矩阵,即每行每列之和相等
数组(利用冒号或
linspace函数生成向量)例:
a=0:0.02:1
x=linspace(0,1,75)
二维数组元素的标志:
''全下标''标志:如
A(3,5)''单下标''标志:设想二维数组的所有列,按先左后右的次序,首尾相接排成”一维长列“,然后自上而下对元素位置编号。
矩阵运算
在
MATLAB中提供了如下矩阵运算符, +加法 -减法 *乘法 ^幂 / 右除 \左除 ‘ 转置(1) 加法、减法运算
例:
>>A=[23 4 5;6 7 60;20 45 78]
>>B=[4 90 2 ;56 64 4;0 10 30]
>>A+B % 或 plus(A,B)
>>A-B  % 或 minus(A,B)
(2) 矩阵乘法运算
>>A*B %必须符合m*n与n*l结构
(3)矩阵的左除和右除
右除 :A/B 相当于B*inv(A),x*A=B的解
左除 :A\B 相当于inv(A)*B,A*X=B的解
(4) 矩阵转置运算 (transpose函数,或’)
例:>>v=[-1;4;5]
v=
-1
4
5
>>x=v’
x=
-1   4    5
x=transpose(v);
(5) 矩阵的幂运算
(6) 矩阵的点运算
(7) 矩阵与常数的运算
矩阵与常数的运算即常数与矩阵中每一个元素之间进行运算
A=[80  10  60
   30  50  70
   40  90  20]
b=5;
B=A+b;
C=b*A;
D=A/b;
1.9. size函数
 X = rand(2,3,4);
 d = size(X)              %returns  d = [2 3 4]
 [m1,m2,m3,m4] = size(X)  %returns  m1 = 2, m2 = 3, m3 = 4, m4 = 1
 [m,n] = size(X)          %returns  m = 2, n = 12
 m2 = size(X,2)           %returns  m2 = 3
1.10. 函数文件
函数文件由 function 语句引导
function 输出形参列表=函数名(输入形参列表)
% 注释说明部分(可选)
% 函数体语句(必须)
function  [out1,out2,..] = filename(in1,in2,..)
第一行为引导行,表示该 M文件是函数文件
函数名的命名规则与变量名相同 ( 必须以字母开头 )
- 当输出行参多于一个时,用方括号括起来
- 函数必须是一个单独的 M文件
- 函数文件名必须与函数名一致
- 以百分号开始的语句为注释语句
return语句用于退出正在运行的脚本或函数,通常用在函数文件中。
1.11. 局部函数
- 函数文件运行时,
matlab会专门开辟一个临时工作区间,称为函数工作区间。 - 函数文件中的变量都是局部的,即一个函数文件中定义的变量不能被另一个函数文件或其它 M 文件使用。
- 当函数调用完毕后,该函数文件中定义的所有局部变量都将被释放,即全部被清除。
- 函数通过输入和输出参数与其它 M 文件进行数据传递
- 如果在M函数中,调用某个M脚本文件,那么该脚本文件运行时产生的所有变量都存放于该函数空间中
1.12. 函数调用
- 函数定义:
function y = dfw1(r,p) %形参
- 函数调用的一般格式: 输出实参列表 = 函数名(输入实参列表)
z = dfw1(x,k) %实参
- 函数调用时,实参的顺序应与函数定义时的形参的顺序一致。
1.13. 子函数
函数文件中可以含有一个或多个子函数
子函数由 function 语句引导
主函数必须位于最前面,子函数出现的次序任意
子函数只能被主函数和位于同一个函数文件中的其它子函数调用
除了用 global 定义的全局变量外,子函数中的变量都是局部变量,子函数与主函数及其它子函数之间通过输入、输出参数进行数据传递
function [sum1,sub1]=selffunc(a,b)
sum1=func1(a,b);
sub1=func2(a,b);
function x=func1(x1,x2)
     x=x1+x2;
function y=func2(y1,y2)
        y=y1-y2;
1.14. MATLAB控制语句
选择结构
if语句
(1)if 逻辑表达式
       执行语句
    end
(2)if 逻辑表达式
      执行语句1
    else
      执行语句2
    end
(3)if 逻辑表达式1
       执行语句1
    elseif 逻辑表达式2
       执行语句2
    else
       …
    end
% 关系与逻辑运算符 > >= < <= == ~= | %与 & %或 ~ %非 % || && 逻辑运算符switch 语句
switch   表达式(可以是标量或字符串)
  case  值1
      语句1
  case  值2
      语句2
  otherwise
      语句3
end
例:输入学号,输出姓名,成绩…
x=input('input studentID:');
switch x
 case 123
   disp('ZHANG San');
 case 456
   disp('LI Si');
 otherwise
   disp('NO this student');
end
循环结构
- for循环语句
% 基本格式 for 循环变量=起始值:步长:终止值 循环体 end- while循环语句
% 基本格式
while  表达式
   循环体
end
3.其他控制语句
continue: continue语句通常用在循环控制中,包括 for 循环和 while 循环,用于结束当次循环,继续执行下一次循环,但是不结束当前循环。一般 continue 语句与 if 语句相结合,当满足一定的条件时,执行 continue 语句。break: 与 continue 相同的是,break 函数也是用于循环控制,中断当前循环。与 continue 不同,break 跳出当前循环,不再执行该循环的任何操作。
return:结束该程序的执行,返回到调用函数或者键盘。
1.15. Matlab绘图
函数plot常用的使用格式
plot(x) % 缺省自变量
plot(x,y)%:** **单条曲线**
plot(x1,y1,x2,y2,…)% :** **多条曲线**
plot(x,y,'s') % :带属性修饰的曲线**
% 's’ %属性开关描述自符串变量**
% 曲线实例:
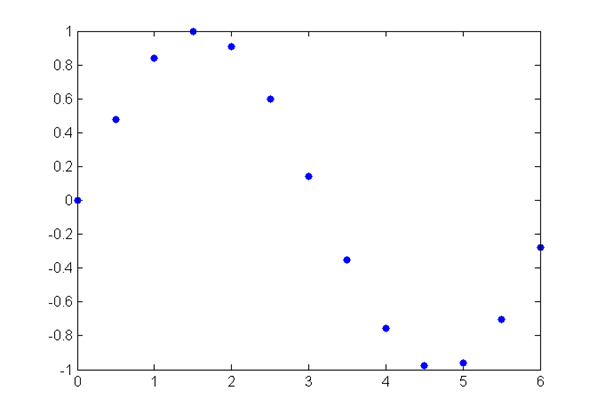
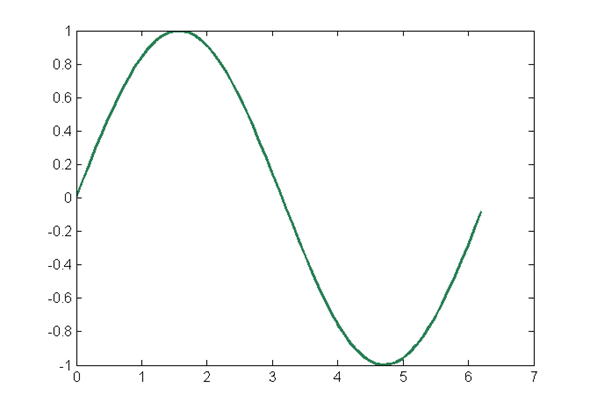
>> y=sin(x), 0<x<2*pi
>> x=[0:0.5:2*pi];
>> y=sin(x);
>> plot(x,y,'.')
% 采样点对绘图的影响(续)
% 曲线实例:
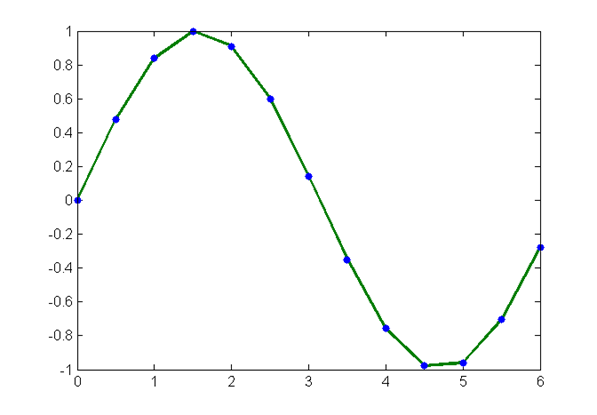
>> x=[0:0.5:2*pi];
>> y=sin(x),0<x<2*pi
>> y=sin(x);
>> plot(x,y,'.-','lineWidth',2,'color',[.2,.5,.2],'markerSize',20,'markerEdgeColor','b')
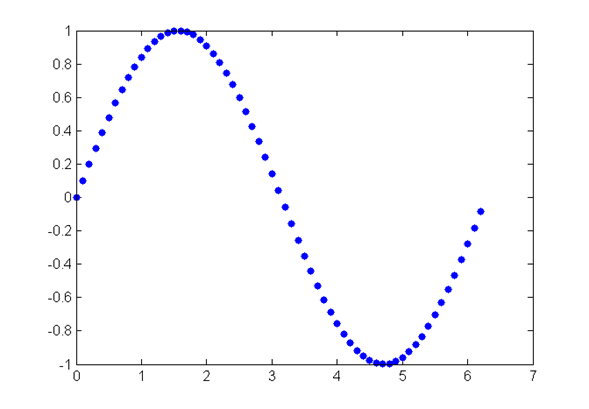
- 插值曲线欠光滑
% 曲线实例:
>> y=sin(x), 0<x<2*pi
>> x=[0:0.1:2*pi];
>> y=sin(x);
>> plot(x,y,'.')
% 曲线实例:
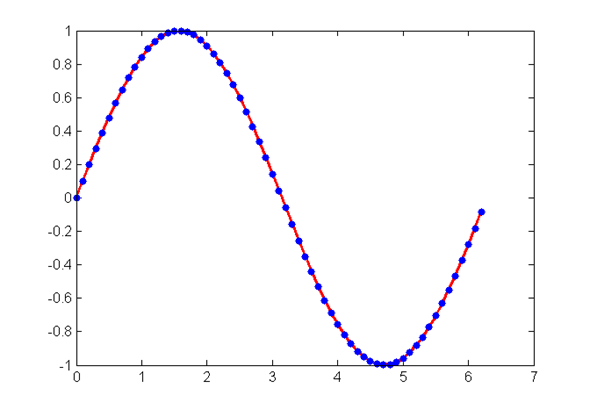
>> y=sin(x), 0<x<2*pi
>> x=[0:0.1:2*pi];
>> y=sin(x);
>> plot(x,y,'.-','LineWidth',2,'Color','r','MarkerSize',20,'MarkerEdgeColor','b');
% 采样点对绘图的影响(续)
% 曲线实例:
>> y=sin(x), 0<x<2*pi
>> x=[0:0.1:2*pi];
>> y=sin(x);
>> plot(x,y,'-','LineWidth',2,'color',[0.2,.5,0.2])
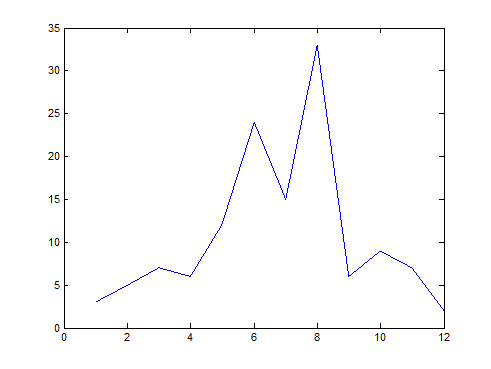
• Plot 使用实例: 因变量缺省
>> x=[3 5 7 6 12 24 15 33 6 9 7 2];
>> plot(x) %绘制以序号为横坐标,元素值
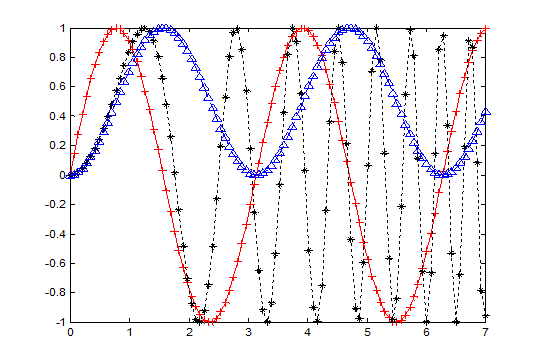
% Plot 使用实例: 多条曲线
>> x=linspace(0,7);
>> y1=sin(2*x);
>> y2=sin(x.^2);
>> y3=(sin(x)).^2;
%曲线1:红色实线,+号显示数据点
%曲线2:黑色点线,*号显示数据点
%曲线3:蓝色虚线,上三角形显示数据点
>> plot(x, y1, 'r+-', x, y2, 'k*:', x, y3, 'b--^')
例: 绘制三维曲线。
程序如下:
t=0:pi/100:20*pi;
x=sin(t);
y=cos(t);
z=t.*sin(t).*cos(t);
plot3(x,y,z);
title('Line in 3-D Space');
xlabel('X');ylabel('Y');zlabel('Z');
grid on;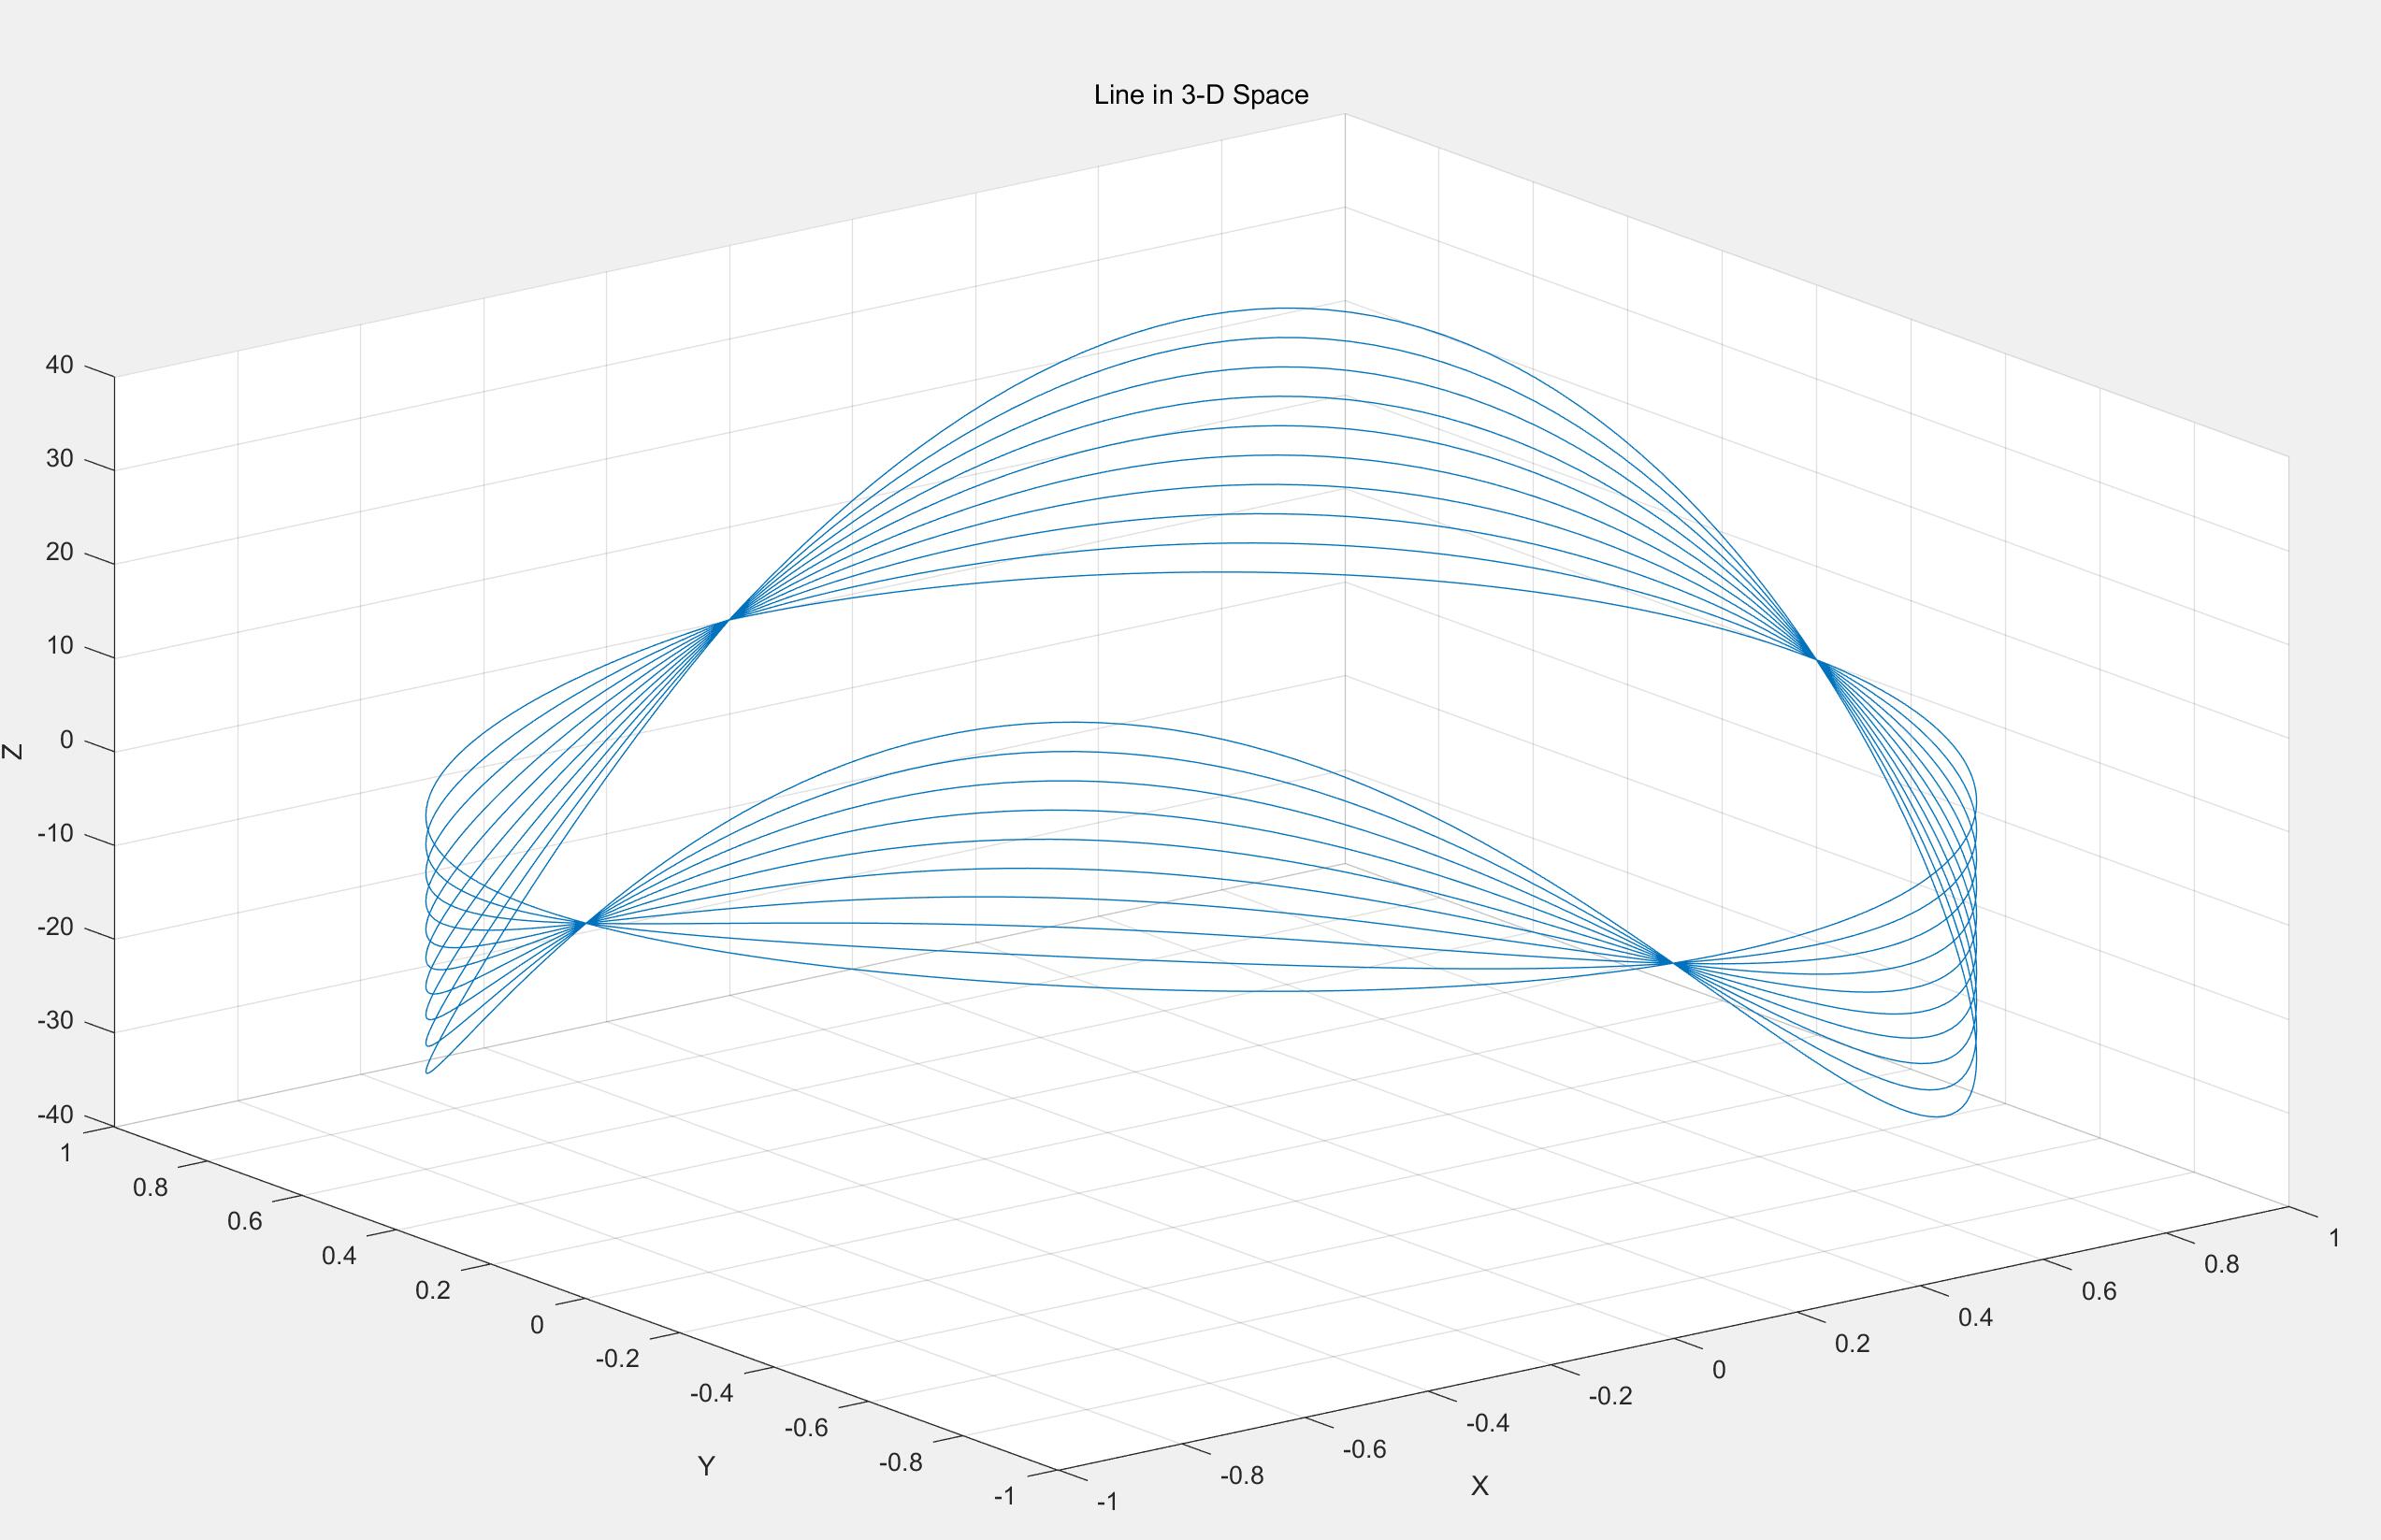
meshgrid 函数: Generate X and Y matrices for three-dimensional plots
[X,Y] = meshgrid(x,y)
% 在MATLAB中,利用meshgrid函数产生平面区域内的网格坐标矩阵。
surf函数和mesh函数的调用格式为:
mesh(x,y,z)
surf(x,y,z)
一般情况下,x,y,z是维数相同的矩阵。x,y是网格坐标矩阵,z是网格点上的高度矩阵
绘制二元函数z=4x-8y2 和z=2x-3y, x,y∈[-2,2],且确定空间交线。
 x=linspace(-2,2,21);
 y=linspace(-2,2,21);
 [X,Y]=meshgrid(x,y);
 Z1=4*X-8*Y.^2;
 Z2=2*X-3*Y;
 mesh(X,Y,Z1);
 hold on;
 mesh(X,Y,Z2);
三维曲线
% plot3函数与plot函数用法十分相似,其调用格式为:
plot3(x1,y1,z1,选项1,x2,y2,z2,选项2,…,xn,yn,zn,选项n)
其中每一组x,y,z组成一组曲线的坐标参数,选项的定义和plot函数相同
1.16. 动画
1.16.1. 基本动画
%% set parameters
Nt=100; % Number of time steps
xmin=0.1;
xmax=0.9;
yval=0.3;
%% create array
x=linspace(xmin,xmax,Nt);
%% animate position
for it=1:Nt
plot(x(it), yval,'ro');
axis([0, 1, 0, 1]);
drawnow
end
%% set parameters Nt=100; % Number of time steps xmin=0.1; xmax=0.9; yval=0.3; dt=0.03; % time step in seconds—change to vary speed %% create array x=linspace(xmin,xmax,Nt); %% animate position for it=1:Nt plot([x(1), x(it)],[yval, yval],'r',... % plots line x(it), yval,'ro'); % plots circle axis([0, 1, 0, 1]); pause(dt) drawnow end%% set parameters Nt=100; % Number of time steps R=1; % radius of circle T=1; % period of motion (assume time goes from 0 to 1) dt=0.03; % time step in seconds—change to vary speed %% initialize arrays t=linspace(0,1,Nt) x=zeros(1,Nt); y=zeros(1,Nt); %% calculate circular motion for it=1:Nt x(it)=R*cos(2*pi*t(it)/T); y(it)=R*sin(2*pi*t(it)/T); end %% animate circular motion with trailing line for it=1:Nt plot(x(1:it),y(1:it),'r',... % plots curve x(it), y(it),'ro'); % plots point axis(1.2*[-1, 1, -1, 1]); axis square pause(dt) drawnow end